About
graph LR
Webpage[Web page] <--Flask--> Server[Server]
Server <-- Push agent and execute --> Client((Client))
Server[Server] <----> Client2((Client2))
Server[Server] <----> Client3((Client3))
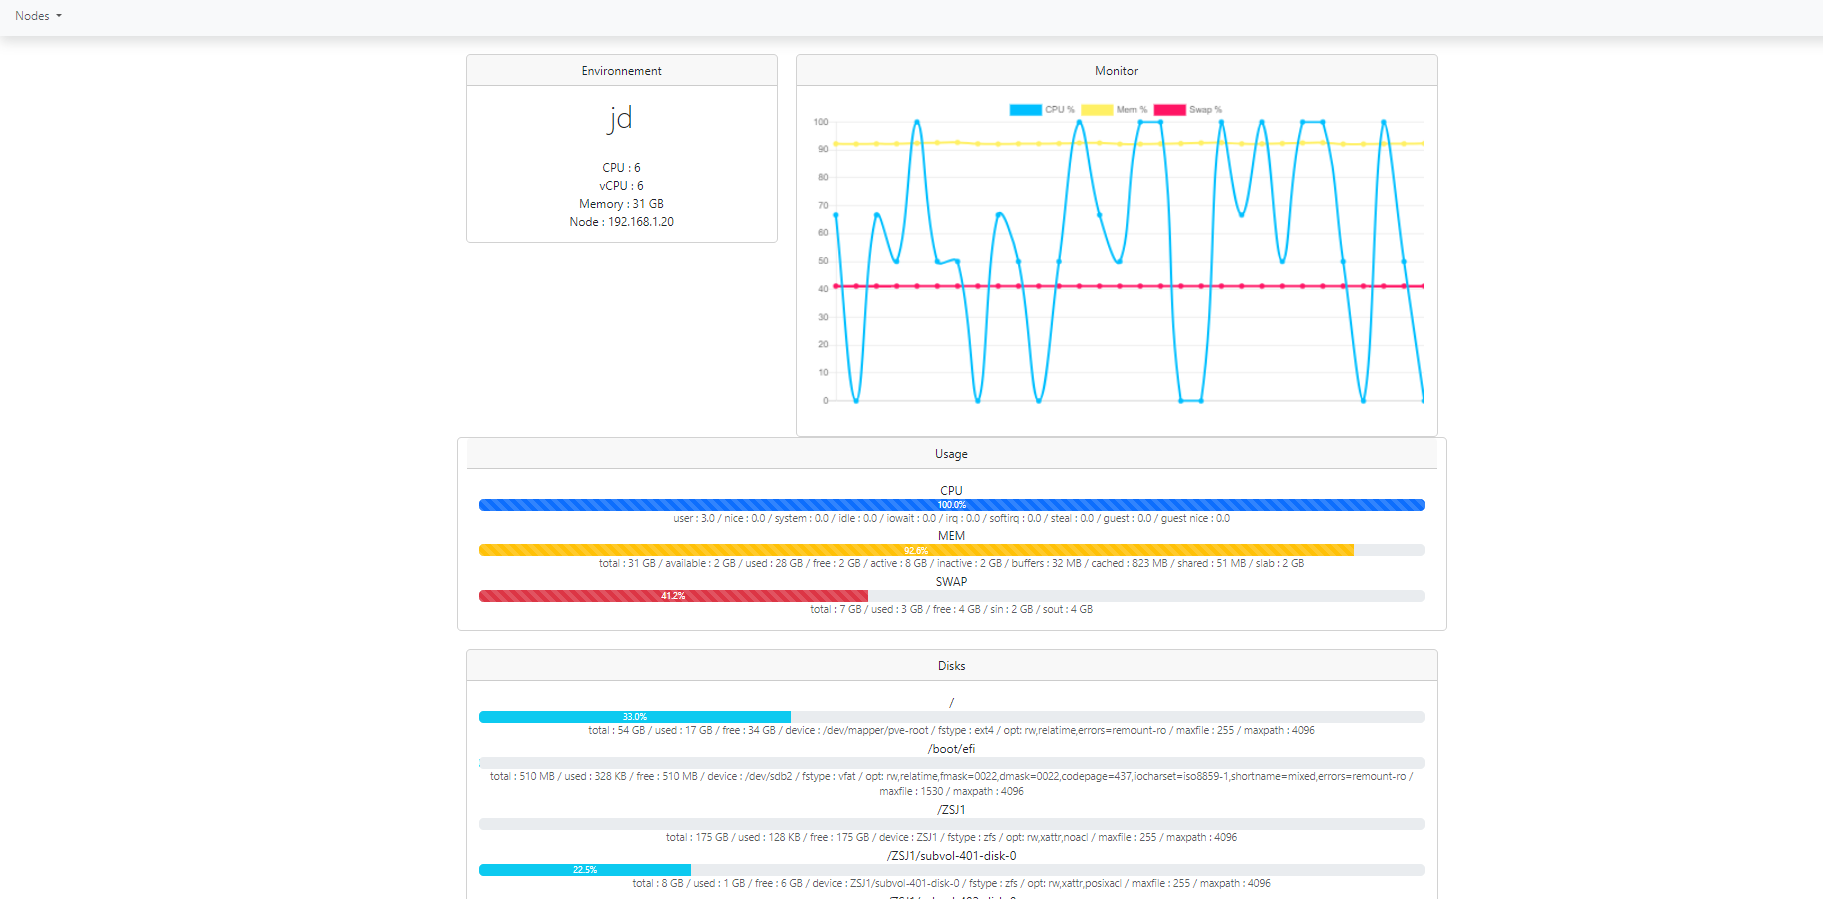
Simple monitoring script. It will push an agent (agent.py) on remote servers to get info about ressources (CPU, Disk, Memories..) And display it on a webpage.
Screenshot
Install
For Debian 12 (and more...)
On server :
apt install python3-flask python3-paramiko python3-psutil
On nodes (if needed):
apt install python3-psutil
For Debian < 12
pip3 install psutil flask paramiko
On nodes :
pip3 install psutil
If you prefer (recommended), you can run in an python env
apt install python3-venv

python3 -m venv Pymonit --system-site-packages
. /Pymonit/bin/activate
pip3 install psutil flask paramiko
Configuration
Clients
Add your clients in the python list in config.py:
client = ['192.168.0.1','server.local','server.mydns']
Generate keys for connection
Becarrefull, avoid using a root user to start application and connect to client. Use a dedicated user.
On server, generate a pair of key :
ssh-keygen -b 2048 -t rsa
And push the public key in your clients :
ssh-copy-id -i <home_user>/.ssh/id_rsa.pub <user>@<client>
Configuration on application
You have to report these info on config.py :
class ssh_conf:
       port = 22
       username = '<user>'
       password ='<home_user>/.ssh/id_rsa.pub'
For testing purpose, but still not recommended, you can use a password in configuration file.
class ssh_conf:
       port = 22
       username = '<user>'
       password ='<password>'
Flask configuration
Configure the flask configuration according to your needs (port,host,...) in config.py
class flask_conf:
       port = 8090
       host = "0.0.0.0"
       thread = True
       debug = False
       reloader = False
NB: Let thread = True, else this will take a time to switch from node to another node
Path configuration
class paths :
    basedir = os.path.abspath(os.path.dirname(__file__))
    agent_path = basedir+'/agent.py'
    remote_path = '/var/tmp/script.py'
remote_path : the location where the agent will be pushed and execute. Take care that your used is able to write and execute in this location.
Systemctl (optional)
To easy start, stop and restart application, you can use the monit.service template.
Replace the path according to your system in :
[Unit]
Description= Monit service
After=multi-user.target
[Service]
Type=simple
Restart=always
ExecStart=/usr/bin/python3 /application/path/app.py
[Install]
WantedBy=multi-user.target
Copy the file in your systemd folder :
cp ./monit.service /etc/systemd/system/
Then you can start it :
systemctl start monit.service
To get it automaticaly start with your system:
systemctl enable monit.service
Change log
v1 :
-
Create Agent:
- CPU detail
- Memory detail
- Swap detail
-
Agent communication :
- SSH using Python
- Push and Run agents
- Retrieve info
-
Interface:
- Creation
- Bootstap
- Delete
v1.1
-
Adding Disk usage info
- Get partitions
- Get usage
-
Adding Network info:
- Get interfaces
- Get info (IP,netmask)
v2:
- Create Live view of SWAP,CPU,Memory usage
- Adding Chart to interface
v2.1 On going :
- Add Network usage
- Add boot time
- Update dynamically Progress Bar
Next:
- Retrieve Process runnning (top ?)
- Add alerting (?)
- Create admin page for threshold and alert
- Manage alert communication (Mail, SMS...)


